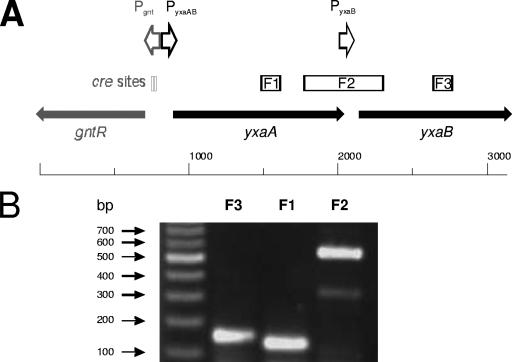
FIG. 3.
Analysis of cotranscription of yxaA and yxaB. (A) The identified promoter in the analyzed region is marked by arrows. Fragments amplified by RT-PCR analysis are marked by boxes. (B) RT-PCR amplification. MW, DNA molecular mass marker (Fermentas); F3, inside of yxaB; F1, inside of yxaA; F2, distal part of yxaA and proximal part of yxaB.

