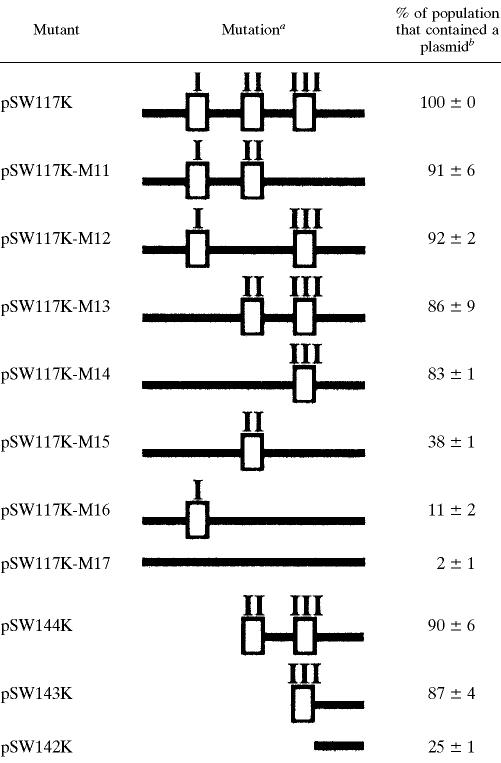
TABLE 1.
Mutations in the P-E region and the stability of pSW117K derivatives
The region deleted from each plasmid is shown schematically. Empty boxes denote three A-T-rich sequences in the P-E region labeled I, II, and III (Fig. 1B).
Percentage of the population that contained a plasmid after 84 generations of culturing in LB broth.

