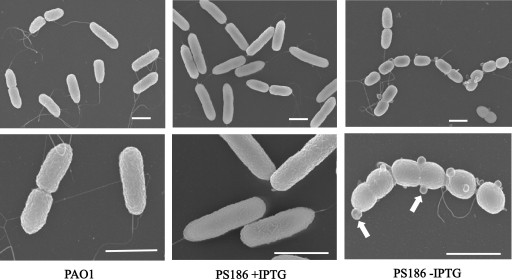
FIG. 3.
Electron micrographs of PAO1 and PS186 cells at the 13-h growth point from Fig. 1B. Upper panels were taken at low magnification, and lower panels were taken at high magnification. Results are representative images. Arrows indicate membrane vesicles. The bar equals 1 μm in all panels.

