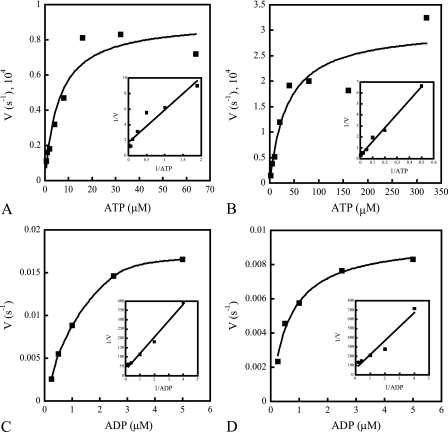
FIG. 6.
Kinetics of MBP-NarX185 and MBP-NarQ182 autophosphorylation (A and B) and dephosphorylation (C and D). Quantifications of autophosphorylation and dephosphorylation rates were performed as stated in Materials and Methods. The insets represent Lineweaver-Burk plots of the corresponding reaction velocities as 1/V versus 1/ATP or 1/ADP. Autophosphorylation kinetics were performed with an ATP-regenerating system in 30 nM [γ-32P]ATP (∼7,000 cpm fmol−1) with different concentrations of unlabeled ATP. (A) Autophosphorylation rates of MBP-NarX185 incubated with increasing concentrations of ATP (0.5, 1, 2, 4, 8, 16, 32, and 64 μM). The x intercept (KmATP) was 2.5 μM. The y intercept (k) was 0.59 × 10⁻⁴ s−1. (B) Autophosphorylation rates of MBP-NarQ182 incubated with increasing concentrations of ATP (2, 5, 10, 20, 40, 80, 160, and 320 μM). The x intercept (KmATP) was 24.6 μM. The y intercept (k) was 3.0 × 10⁻⁴ s−1. (C) Dephosphorylation rates of phospho-MBP-NarX185 (∼3,000 cpm/fmol) incubated with increasing concentrations of ADP (0.25, 0.5, 1, 2.5, and 5 μM). The x intercept (KmADP) was 2.9 μM. The y intercept (−k) was 0.033 s−1. (D) Dephosphorylation rates of phospho-MBP-NarQ182 (∼4,000 cpm/fmol) incubated with increasing concentrations of ADP (0.25, 0.5, 1, 2.5, and 5 μM). The x intercept (KmADP) was 2.2 μM. The y intercept (−k) was 0.015 s−1. The data shown are from one of three independent measurements from various protein purification preparations.

