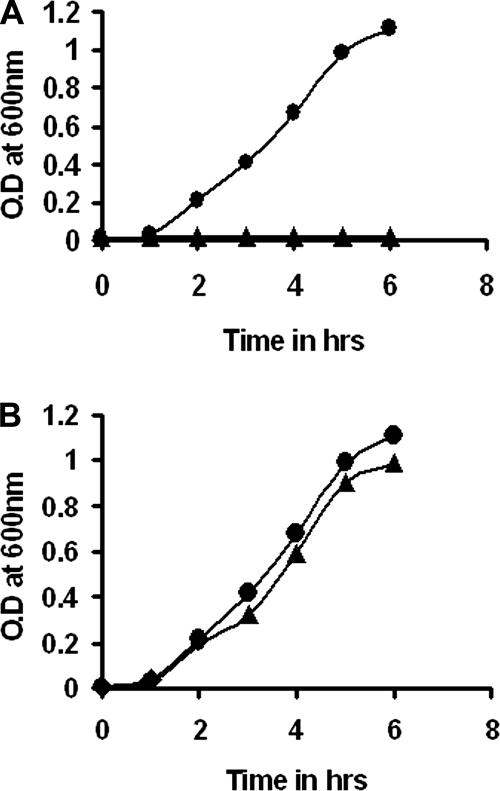
FIG. 7.
Growth curves for strains BSK1 and BSK2. Cultures were grown to log phase and subcultured in fresh medium with and without mitomycin C. Bacterial growth was monitored by determining the optical density at 600 nm (O.D at 600 nm). (A) •, uninduced strain BSK2; ▴, strain BSK2 induced with mitomycin C. (B) •, uninduced strain BSK1; ▴, induced BSK1 cells.

