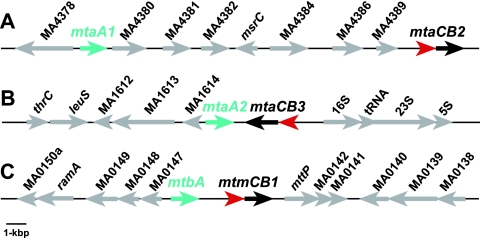
FIG. 1.
Physical maps of the mtaA genes in M. acetivorans. A 20-kbp DNA region surrounding mtaA1 (A), mtaA2 (B), and the mtbA gene mtaA2 (C) is shown. mtaA1, mtaA2, and mtbA are shown as aquamarine arrows; mtaC2 and mtaC3 are shown as red arrows; and mtaB2 and mtaB3 are shown as blue arrows. Other open reading frames are shown as gray arrows.

