FIG. 1.
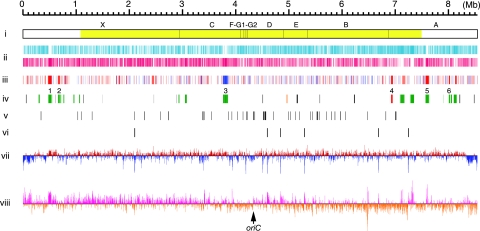
Schematic representation of the S. griseus chromosome. (i) DraI physical map. Fragments observed after pulsed-field gel electrophoresis are indicated above the bar. The largest fragment, X, was not detected by Southern blotting using linkage clones as probes. The yellow color indicates the “core region.” (ii) Distribution of ORFs according to direction of transcription (positive strand, upper line; negative strand, lower line). (iii) Distribution of genes that were affected by adpA disruption shown by DNA microarray analysis (P < 0.05, n = 4). Red, >2-fold upregulated in the wt strain in comparison with the ΔadpA mutant; blue, >2-fold downregulated in comparison with the ΔadpA mutant. (iv) Distribution of secondary metabolite gene clusters. Red, streptomycin (str, sts); orange, grixazone (gri); green, PKS and/or NRPS; black, other. Six secondary metabolite gene clusters, the transcription of which is affected by adpA disruption, are indicated as numerals above the line. 1, SGR443 to SGR455 (NRPS); 2, SGR574 to SGR593 (NRPS); 3, SGR3239 to SGR3288 (type II PKS and NRPS); 4, SGR5914 to SGR5940 (streptomycin); 5, SGR6360 to SGR6387 (type I PKS); 6, SGR6709 to SGR6717 (NRPS). (v) Distribution of tRNA genes. (vi) Distribution of rRNA operons. (vii) G+C content percentage variation for nonoverlapping 5-kb window. Red and blue are above and below the mean, respectively. (viii) GC-skew for 3-kb window and 1-kb step. Deep pink and dark orange are above and below zero, respectively. The putative oriC gene is indicated by an arrow.

