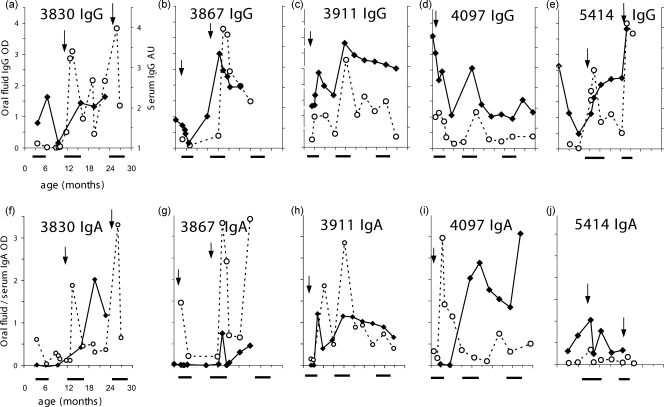
FIG. 1.
Evaluation of oral fluid for the detection of RSV infection in birth cohort children from rural Kenya, 2002 to 2005. Shown are specific IgG (a to e) and corresponding IgA (f to j) levels in serum (filled diamonds) and oral-fluid (open circles) samples from five individuals followed from birth over three epidemics (solid horizontal bars below graphs). Arrows indicate time (age) points of IFAT-positive clinical episodes. The labeling and scales for the x and y axes in graph a apply to graphs a to e, and those in graph f apply to graphs f to j.

