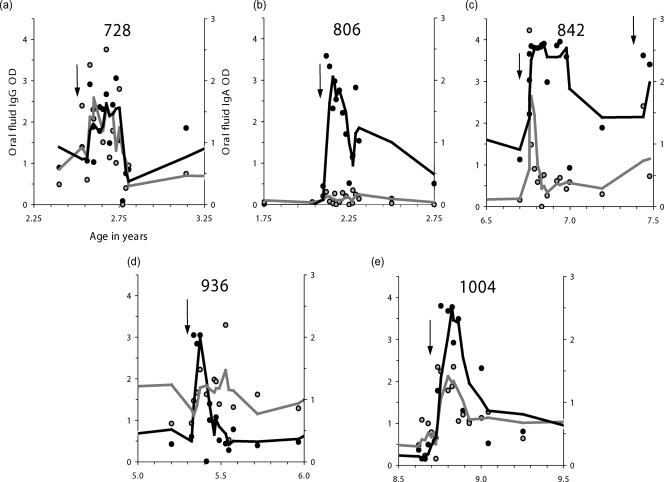
FIG. 2.
Evaluation of oral fluid for the detection of RSV infection in children from a family study in rural Kenya. Shown are specific IgG (solid symbols and lines) and IgA (shaded symbols and lines) levels in oral fluids from five children in a family cohort study who were sampled every 3 months routinely and every week for 13 weeks following each IFAT-positive clinical episode (arrows identify time points of infection). Lines through data are 3-point moving averages. The labeling and scales for the y axes of graph a apply to graphs a through e. For each graph, the age in years is given along the x axis.

