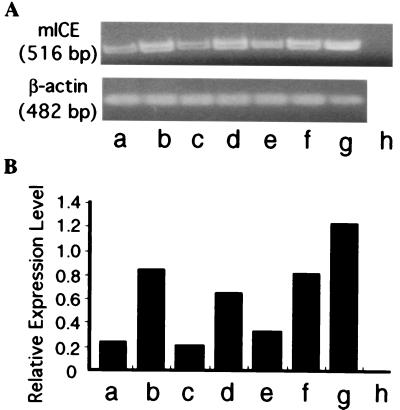
Figure 1.
(A) ICE mRNA expression of the tumor cell lines by RT-PCR. (B) Densitometric analysis of ICE mRNA expression. (A) The cDNA samples obtained by RT-PCR for mICE and β-actin were loaded on the 2% agarose gel. (B) Relative expression level means the ratio obtained from the density of band of ICE mRNA expression standardized by that of β-actin mRNA expression. The representative data of three separate experiments are shown. a, TS/A; b, TS/A transfected with ICE cDNA; c, LLC; d, LLC transfected with ICE cDNA; e, B16; f, B16 transfected with ICE cDNA; g, RAW 264.7; h, COS-7 cells.

