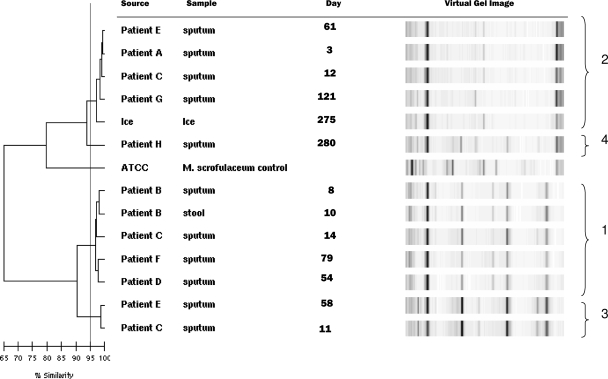
FIG. 2.
Rep-PCR-based dendrogram illustrating the relationship among clinical and environmental isolates of a “M. paraffinicum” pseudo-outbreak. The ATCC M. scrofulaceum strain was included as an unrelated control. The KL distance method was used to create a pair-wise percent similarity matrix, and the tree was generated using the unweighted-pair group method of arithmetic averages. The horizontal scale bar indicates the percents similarity among strains. Clusters 1 to 4, shown at the right, were defined by a 95% similarity threshold (vertical line).

