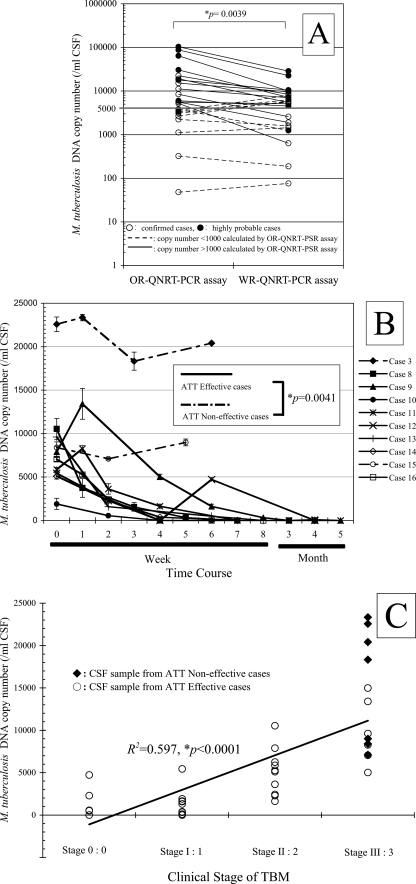
FIG. 1.
Statistical analysis for WR-QNRT-PCR assay in clinical application. (A) Statistical comparison between OR- and WR-QNRT-PCR results by Wilcoxon signed-rank test. (B) The progress of M. tuberculosis DNA copy numbers calculated by the WR-QNRT-PCR assay during a clinical time course for 10 suspected TBM patients (cases 3 and 8 to 16). A statistical comparison between the ATT-effective cases (cases 8 to 14 and 16) and the ATT-noneffective cases (cases 3 and 8) was calculated by repeated-measures ANOVA. (C) Result of simple regression analysis between M. tuberculosis DNA copy number (y axis) and clinical stage of TBM (x axis).

