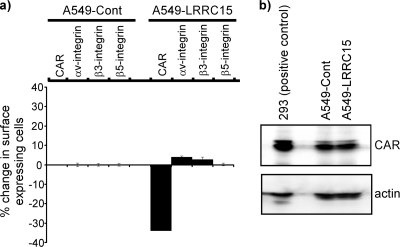
FIG. 5.
LRRC15 decreases cell surface, but not total, CAR levels. (a) A549-LRRC15 and A549 control (Cont) cells were analyzed for surface expression of the following parameters, which are known to affect adenoviral transduction: CAR, integrin αv, integrin β3, and integrin β5. Surface expression was quantified by flow cytometry, and the percentage of cells showing a change in surface expression in A549-LRRC15 cells is shown relative to that observed in A549-Cont cells. (b) Total CAR levels in A549-LRRC15 and A549-Cont cells were measured by Western blotting. A lysate from 293 cells is included as a positive-control guideline for detection of CAR expression.

