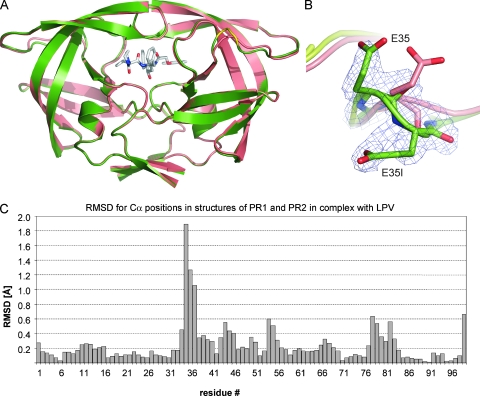
FIG. 4.
(A) Superposition of the crystal structures of PR1 and PR2 in complex with lopinavir. The protease is shown in ribbon representation: PR1 in green with insertion 35EE is shown in yellow, and PR2 is shown in salmon. The active-site-bound inhibitor is shown in sticks with carbon atoms shown in gray and nitrogen and oxygen atoms shown in blue and red, respectively. For the sake of clarity only one of the two alternative conformations is shown. (B) Detail of insertion region shown on superimposed structures of PR1 (green) and PR2 (salmon). The 2Fo − Fc (the observed and calculated structure factors, respectively) electron density map contoured at the 1.0 σ level is shown for the E35EE insertion in PR1. (C) Plot showing the RMSDs for positions of individual Cα atoms after superposition of the PR1 and PR2 structures.

