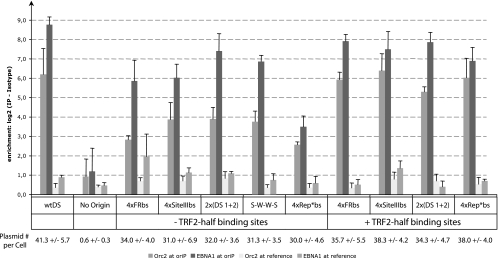
FIG. 4.
Histogram comparing the association of ORC2 and EBNA1 with the engineered origins of DNA synthesis after establishment in 293/EBNA1 cells. The y axis gives the log2 values that denote the difference in crossing point values between DNA fragments containing the test origin or a distal control region on the plasmid when immunoprecipitated with a specific antibody to ORC2 or EBNA1 and the observed signal when immunoprecipitated with an isotype control antibody (25). The wtDS origin, a no-origin control, and the engineered origins of DNA synthesis are listed on the x axis.

