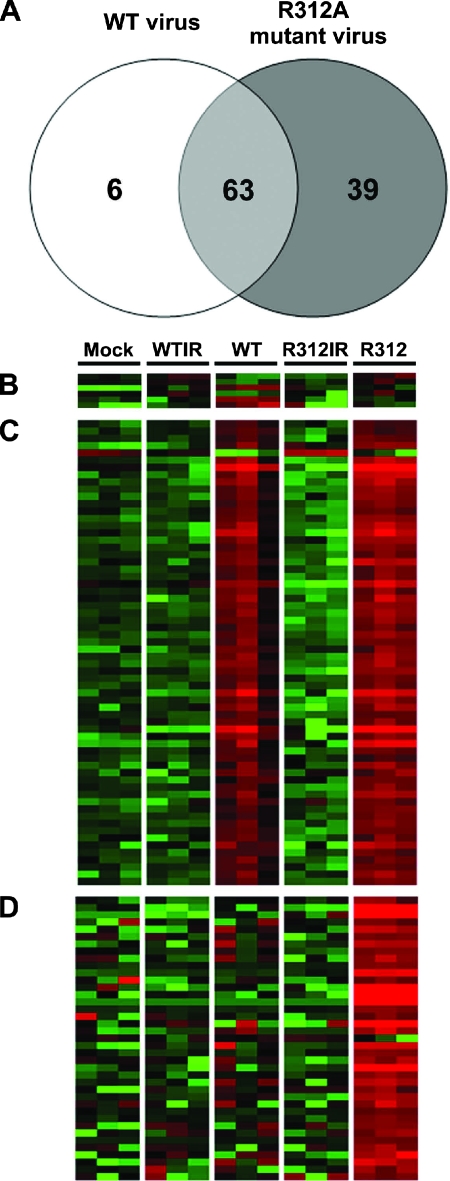
FIG. 2.
Differential gene expression determined by microarray. (A) Venn diagram representing the 108 genes that were significantly differentially expressed when either the recEbo-VP35/WT or recEbo-VP35/R312A viruses were compared to the irradiated and mock-infected controls. For a complete listing of all 108 genes, see Tables S1 to S3 in the supplemental material. (B) Heat map of six genes unique to cells infected with recEbo-VP35/WT virus. (C) Heat map of the 63 genes differentially expressed in cells infected with both the recEbo-VP35/WT and the recEbo-VP35/R312A viruses. (D) Heat map of the 39 genes unique to cells infected with the recEbo-VP35/R312A virus. Each sample was run in triplicate, which is represented by the three columns. Red represents an increase in gene expression compared to uninfected controls, while green represents a decrease.

