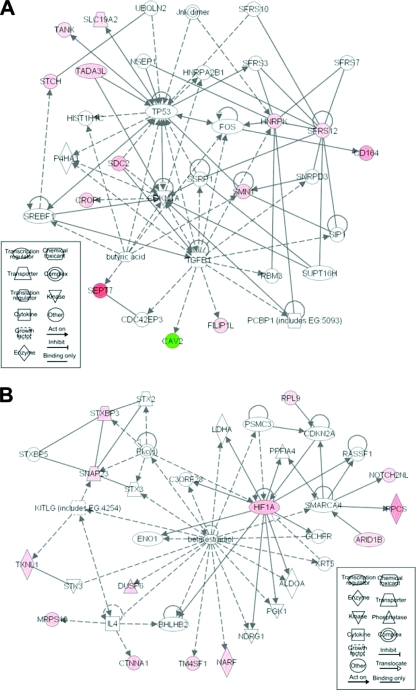
FIG. 3.
Gene networks identified in both recEbo-VP35/WT- and recEbo-VP35/R312A-infected cells compared to mock-infected and irradiated controls. The networks of genes related to RNA posttranscriptional modification (A) and hematological system development and function (B) are shown. The networks were generated from Ingenuity Pathways analysis. The lines in between genes represent known interactions, with solid lines representing direct interactions and dashed lines representing indirect interactions. Red shading indicates an increase in gene expression, and green indicates a decrease in gene expression compared to uninfected controls. The intensity of shading is proportional to the fold difference in gene expression. An explanation of gene names and synonyms can be found in Table S2 in the supplemental material. Network pathway images were created by using Ingenuity Systems software.

