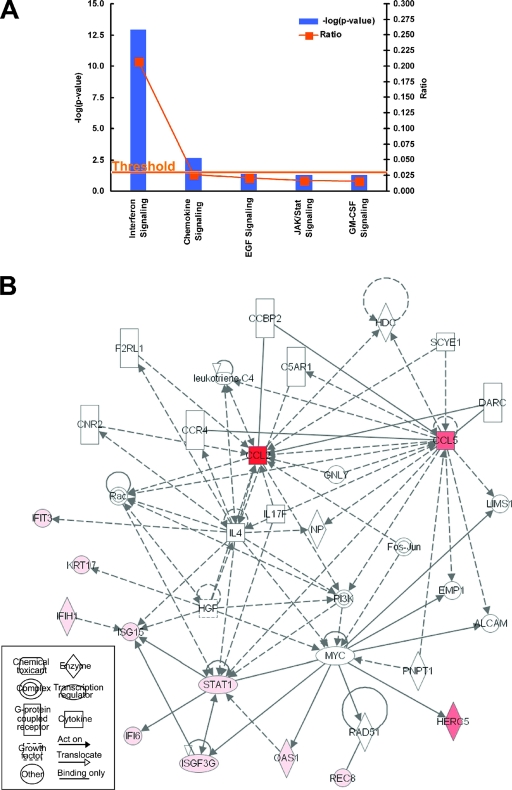
FIG. 5.
Ingenuity Pathways analysis of differentially regulated genes after infection with recEbo-VP35/R312A virus. (A) The 18 significant genes identified by both microarray and TLDA were used for canonical pathway analysis. Blue bars represent various canonical pathways, and the height of the bar represents the P value. Yellow boxes represent the ratio of genes in the list relative to the total number of genes in the pathway. The yellow line indicates the threshold of significance. (B) Network of genes in both the IFN and chemokine signaling pathways that were found to be differentially expressed in recEbo-VP35/R312A virus-infected cells compared to recEbo-VP35/WT virus-infected cells. The lines in between genes represent known interactions, with solid lines representing direct interactions and dashed lines representing indirect interactions. Red shading indicates an increase in gene expression, and green indicates a decrease in gene expression compared to the controls. The intensity of shading is proportional to the fold difference in gene expression. An explanation of gene names and synonyms can be found in Table S3 in the supplemental material. Network pathway images were created by using Ingenuity Systems software.

