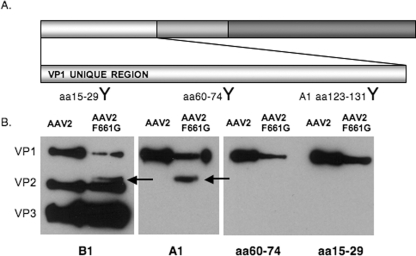
FIG. 9.
AAV2 F661G VP incorporation. (A) Schematic representation of AAV2 VP3 with an enlargement of the VP1 unique region. The shaded regions represent VP1/VP2 and the VP1/VP2/VP3 common regions, respectively. Antibodies generated (Pacific Immunology) recognize specific amino acid stretches in the VP1 unique region, as indicated at the bottom (1:1,000). (B) Western blot analysis of AAV2 and AAV2 F661G capsids with antibodies B1 and A1 (1:20). An additional protein band was detected at ∼77 kDa (arrows).

