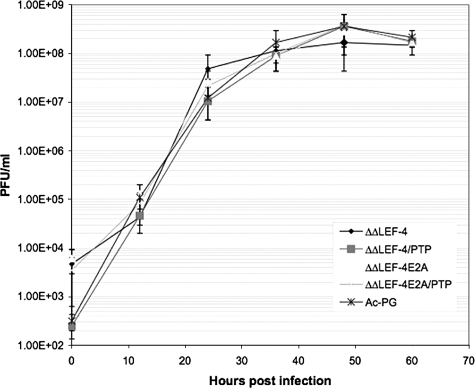
FIG. 3.
One-step growth curve of vAc-PG, vAcΔΔRTPase-PGLEF-4, vAcΔΔRTPase-PGLEF-4/PTP, vAcΔΔRTPase-PGLEF-4E2A, and vAcΔΔ RTPase-PGLEF-4E2A/PTP. Sf-9 cells were infected with the indicated viruses at an MOI of 5. Cell culture supernatants were harvested at the indicated times postinfection and assayed for the production of infectious virus by the TCID50 assay. Each data point represents the average titer derived from independent duplicate sample. Bars represent standard errors.

