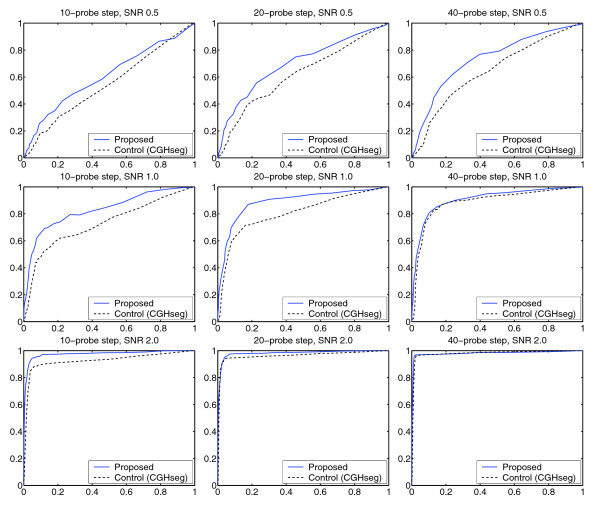
Figure 2.
Receiver operating characteristics. To assess the ability of the proposed method to detect genomic regions with biased gene expression, we determined its ROC curve for different SNRs, aberration sizes and proportions of non-influenced genes (Materials and methods and also Figure 1). This figure (π = 0.1) represents an excerpt from the full set of results (Additional file 1). Key observations: (1) the proposed method exhibits stronger detection performance than the control method (CGHseg); (2) the improvement is present throughout, but is particularly pronounced for low to intermediate SNRs. We conclude that the proposed method exhibits a better trade-off between sensitivity and specificity, especially under expression data-like conditions.

