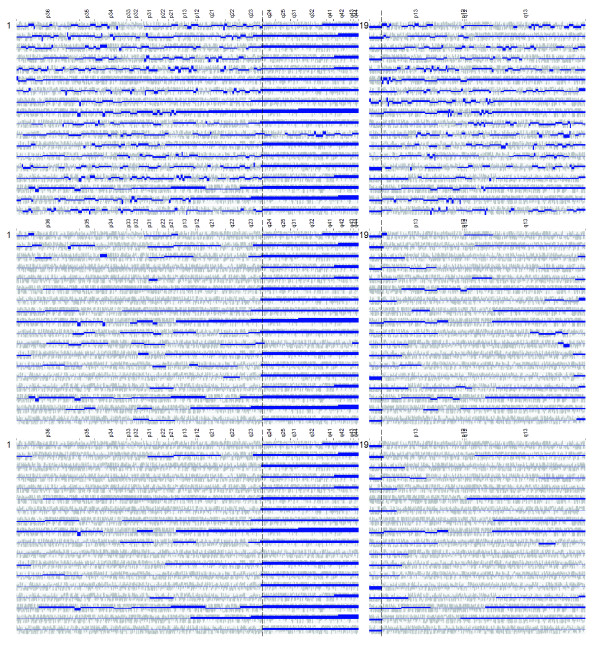
Figure 6.
Application to childhood ALL with TCF3/PBX1 gene fusion. Segmentations of the expression maps of chromosomes 1 and 19 in 18 cases of ALL exhibiting the TCF3/PBX1 fusion oncogene (Ross et al data set) using different method parameters. Light grey: original gene scores. Dark blue: reconstructed expression bias profile. Top: λN = 2/5. Middle: λN = 2/15 Bottom: λN = 2/30. Key observations are as follows. (1) Most cases display over-expression in 1q distal to the PBX1 locus and under-expression over a ~1.6 Mb region on 19p distal to the TCF3 locus (translocation breakpoints indicated by vertical bars). The explanation for this finding is discussed in the Results section. (2) Reducing λN allows the algorithm to emphasize on larger regions, while suppressing smaller regions.

