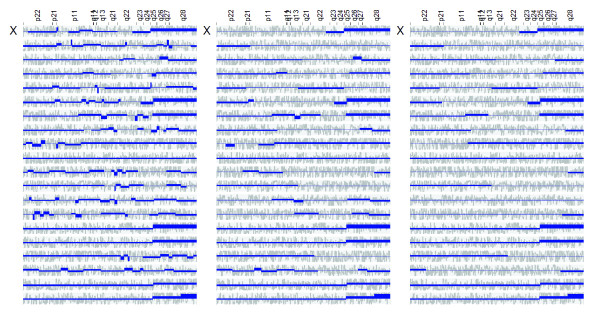
Figure 7.
Application to childhood ALL with ETV6/RUNX1 gene fusion. Segmentations of the expression map of the X chromosome in 20 cases of ALL harboring the ETV6/RUNX1 fusion. Light grey: original gene scores. Dark blue: reconstructed expression bias profile. Top: λN = 2/5. Middle: λN = 2/15 Bottom: λN = 2/30. Key observations are as follows. (1) Several cases exhibited over-expression in Xq25-28, a chromosomal region that was not known to be recurrently gained in ETV6/RUNX1-positive ALL until recently. Following more detailed investigations at our lab using aCGH, the region was shown to be frequently duplicated in this leukemic subtype [20]. Thus, this finding further supports that the proposed method is able to detect genomic regions which expected biases in gene expression, in this case on the basis of a cytogenetically invisible chromosomal aberration. (2) As in Figure 6, reducing λN allows the algorithm to emphasize on larger regions, while suppressing smaller regions.

