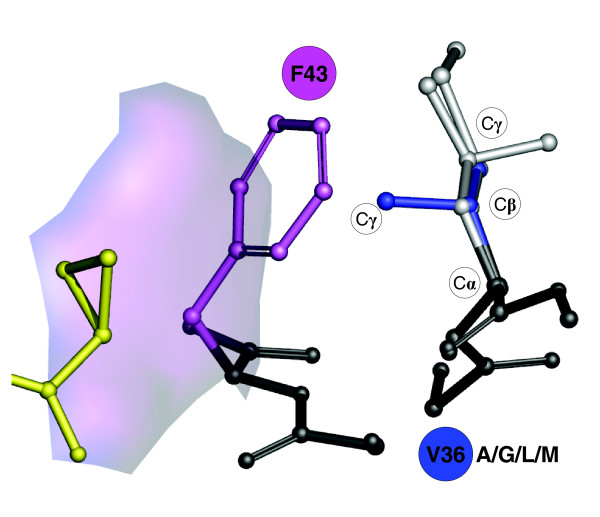
Figure 8.
Rotameric states and conformational differences for V36 mutants A/G/L/M computed with IRECS using the PDB entry 1RTL. The figure illustrates the relative position of mutant side chains (light grey) and the wild-type residue V36 (blue). The important carbon atoms of the side chains are indicated as Cα, Cβ and Cγ. Protein backbone changes are depicted in black. The contribution of F43 to the hydrophobic cavity conformation and the cyclopropyl binding pocket is illustrated by means of a transparent surface patch.

