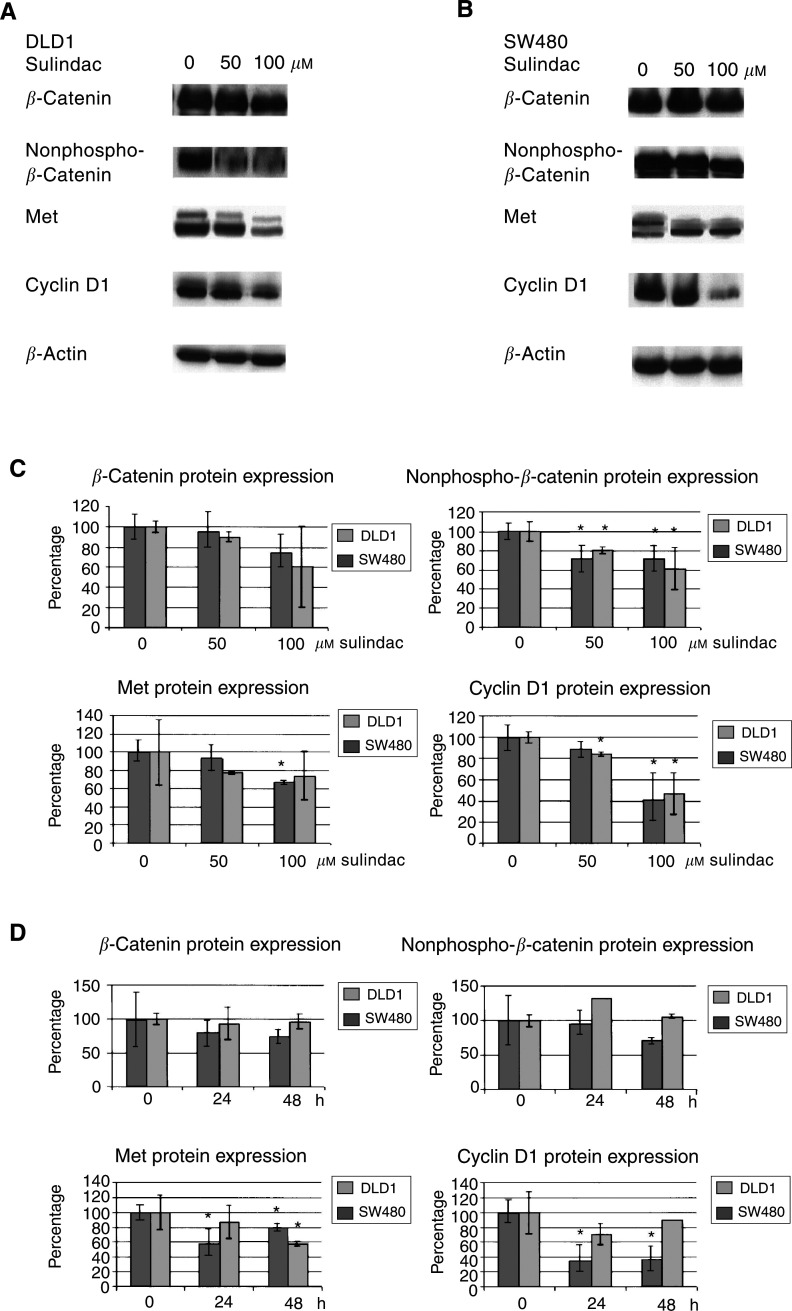
Figure 3.
Kinetics of the effect of sulindac on TCF-regulated target genes. DLD1 (A) or SW480 cells (B) were treated with various concentrations of sulindac sulphide (0–100 μM) for 24 h. Protein lysates were prepared and Western blot analyses performed with antibodies recognising total β-catenin, nonphosphorylated β-catenin, Met and cyclin D1. Blots were analysed by densitometry and each signal was normalised for loading in comparison with the appropriate β-actin signal (C). Data shown are mean values±s.e.m. from three independent experiments. In parallel, DLD1 or SW480 cells were treated with sulindac sulphide (100 μM) for 24 or 48 h (D).

