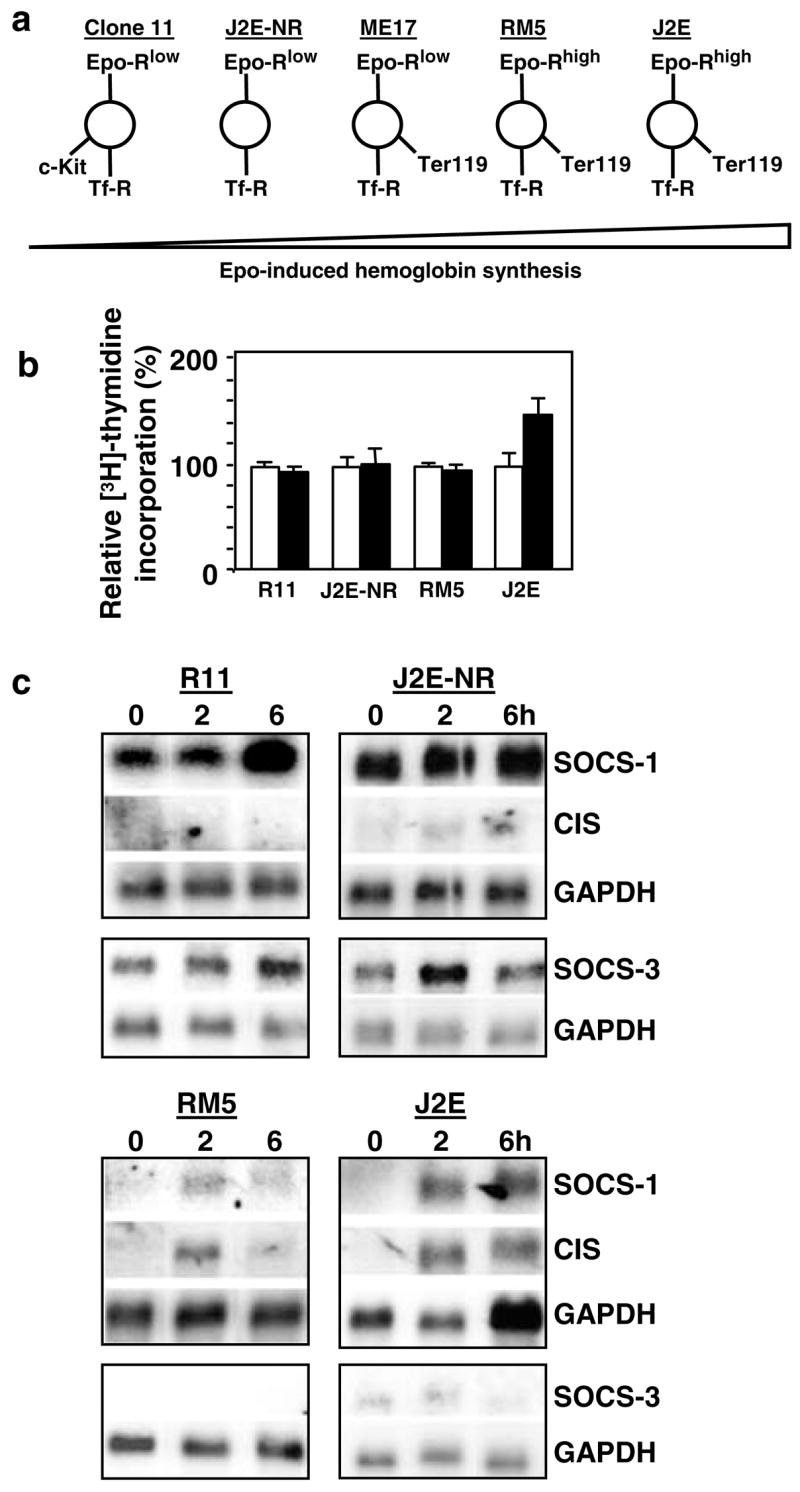
Figure 2.

Expression of SOCS-1, SOCS-3 and CIS mRNA in erythroleukemic cell lines, (a) Flow cytometry was used to characterize cell surface expression of c-Kit, Epo receptor (Epo-R), transferrin receptor (Tf-R) and Ter119 on erythroleukemic cell lines, (b) [3H]thymidine incorporation of unstimulated (white histogram) or Epo-stimulated (5U/ml; black histogram) cells is expressed as a per cent relative to unstimulated cells, (c), Northern analysis of poly A+ RNA from cells stimulated with Epo (5U/ml) for 0–6h. Membranes were probed with SOCS-1, followed by CIS and then GAPDH. Independent membranes were probed with SOCS-3 and GAPDH
