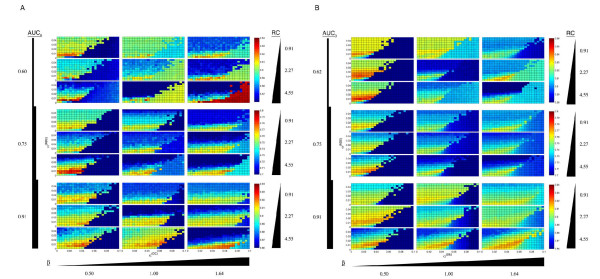
Figure 1.
Effects of AUC0, β, and RC on M-BISON performance. Simulated datasets consist of 1000 genes, with either 10% (A) or 20% (B) DE. We measured performance using AUC of the ROC curve, plotted as a function of α(DE) and α(NDE). Pseudocolor represents AUC magnitude, with dark blue the lowest and dark red the highest (best performance). All simulated data runs contain at least one parameter combination that scores better than the B statistic with microarray data alone (lower left hand corner of each plot), except for AUC0 = 0.91/10% DE/β = 1.64/RC = 0.91.

