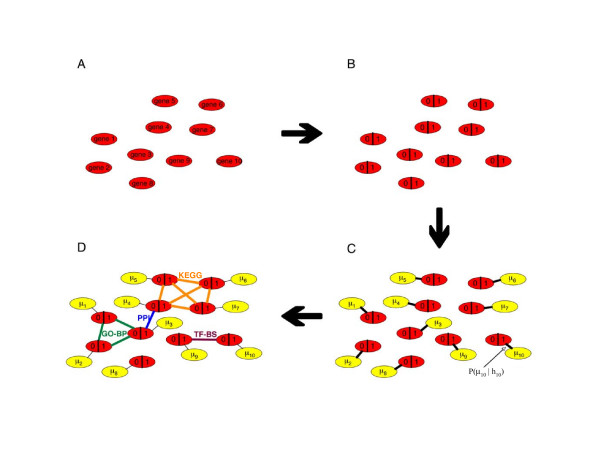
Figure 11.
Graphical depiction of M-BISON model. Each gene is represented by a red node (A), which takes on hidden binary values for differential expression (hk's) (B). Microarray data (yellow) are incorporated probabilistically (μk's) (C), and biological knowledge is used to connect genes that share experimental or annotation information (green, purple, blue, orange edges) (D).

