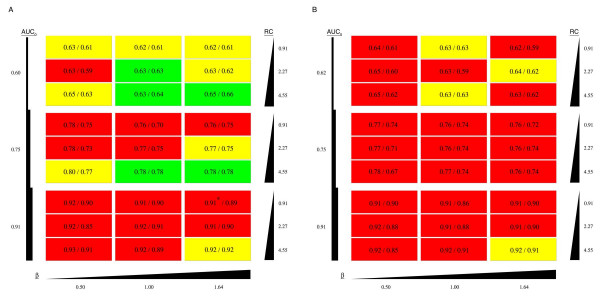
Figure 2.
Comparison of M-BISON and B statistic performance. Simulated datasets are arranged as in Figure 1, one rectangle per dataset, with varying AUC0, β, RC, and number of DE genes. (A) 10% of genes are considered DE; (B) 20% of genes are considered DE. The first number on each dataset is the AUC for single parameter M-BISON (MB1); the second is the AUC for empirical M-BISON (MBe). Colors are used to clarify the difference in performance between using M-BISON and using the B statistic with microarray data only (MA): Green – MBe yields the highest AUC, followed by MB1 and finally MA; Yellow – MB1 yields the highest AUC, followed by MBe and finally MA; Red – MB1 yields the highest AUC, followed by MA and finally MBe. *MA AUC (AUC0) is slightly higher than MB1 AUC.

