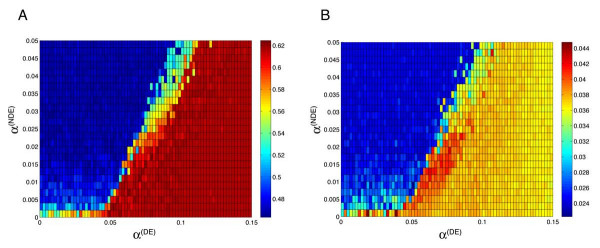
Figure 4.
M-BISON performance on hsf1 dataset as a function of α(DE) and α(NDE). Dataset has the following structure: MD = 21.29; RC = 2.44; β = 2.05; MCC = 0.83. Pseudocolor represents AUC (A) and pAUC.2 (B) magnitude. Ranges of high-scoring parameter values in both plots overlap to yield a "sweet spot" where parameters should be chosen for optimal performance.

