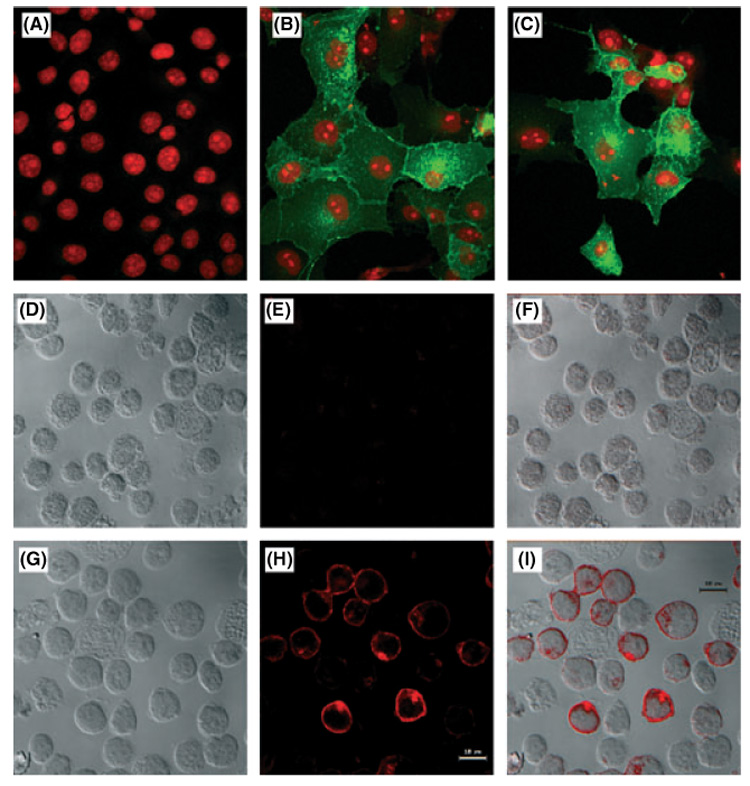
Fig 3.

Localisation of germinal centre B-cell expressed transcript 2 (GCET2) in COS7 and B cells by confocal microscopy. (A) Localisation of GCET2 in COS7 cells. This figure shows the negative control. (B) Localisation of GCET2 in COS7 cells by confocal analysis. Wild-type GCET2 was mainly localised in the cell membrane with some distribution in the cytosol, probably in the Golgi apparatus and the membrane of cytosolic organelles. (C) Localisation of wild-type GCET2 in COS7 cells. (D) Localisation of GCET2 in DHL16 cells. DHL16 cells without pMIG-GCET2 transduction were used as negative control. Cells were stained using mouse anti-V5 monoclonal primary antibody and Texas red conjugated horse anti-mouse IgG secondary antibody. This picture is the Differential Interface Contrast (DIC) of control DHL16 B cells. (E) Fluorescence of control DHL16 cells. The cells were totally negative for red signals. (F) Combination (overlay) of G and H. (G) DIC of pMIG-GCET2 transduced B cell. (H) Red fluorescence of pMIG-GCET2 transduced B cells. Red signals were predominantly in the cell membrane and the Golgi area. (I) Combination (overlay) of J and K.
