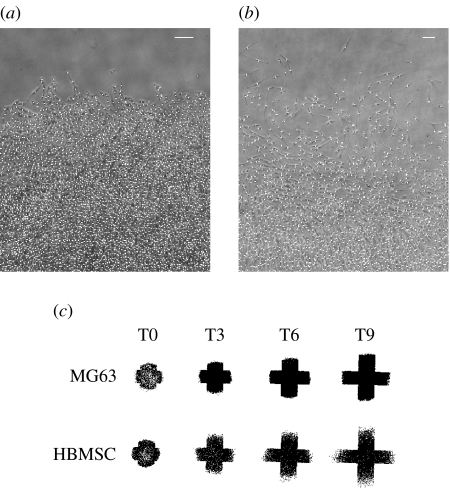
Figure 2.
Example of the migration front at day 9 for (a) MG63s and (b) HBMSCs. Positions of cells identified are indicated by white dots. Both scale bars are 200 μm. (c) Overview of cell circle expansion for MG63 and HBMSC (same scale): all identified cell positions plotted for the same well at days 0, 3, 6 and 9.

