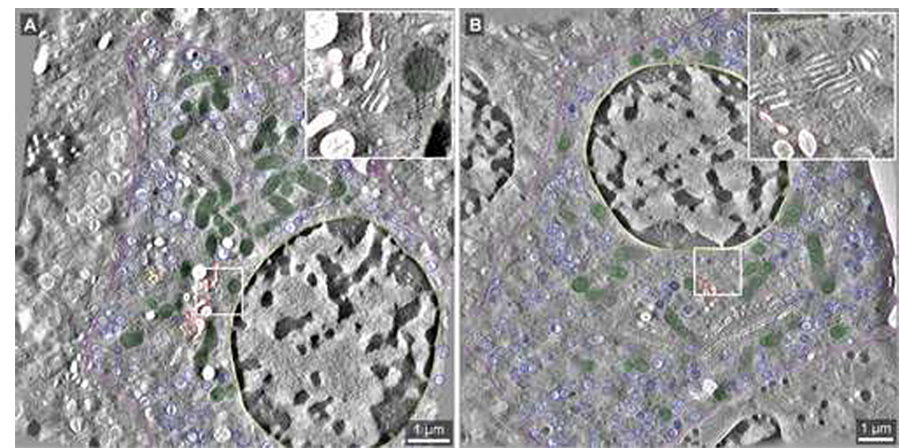
Fig. 2.
Tomographic slices extracted from the whole cell tomograms generated for datasets ribbon01 and ribbon02. The boxed areas reveal the relative membrane clarity for each of the two datasets at higher magnification (inset). A: Slice 939 of 2217 from the dataset ribbon01 (pixel size = 5.156 nm; imaged at 4700× magnification) shows segmentation of the Golgi ribbon (grey), TGN (red), mitochondria (green), mature insulin granules (dark blue), nucleus (yellow), and plasma membrane (purple). B: Slice 556 of 1153 from ribbon02 (pixel size = 6.066 nm; imaged at 3900× magnification). The color coding scheme is as described above for A. Scale bars: 1 µm.

