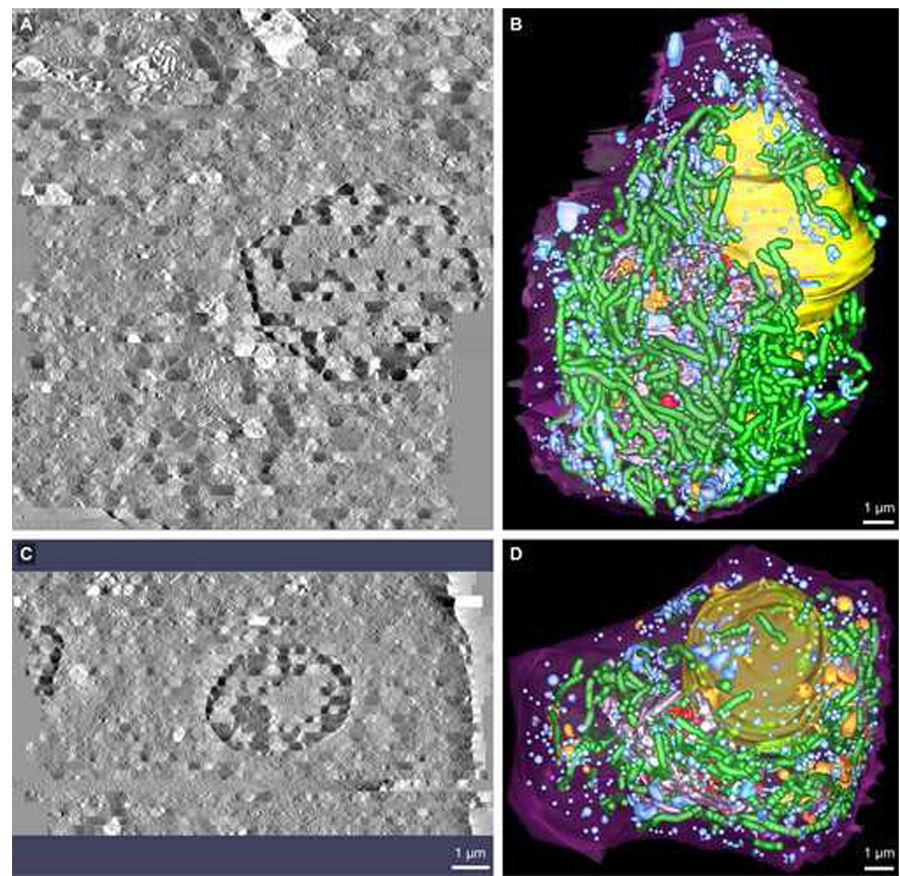
Fig. 3.
Comparison views along the X–Z axis of the surface-rendered 3D model data segmented following serial section ET reconstruction of ribbon01 and ribbon02. A & C: Tomographic volumes that encompassed each of the beta cells designated ribbon01 and ribbon02 were generated by joining 46 and 27 serial section tomograms, respectively. B & D: 3D models revealing key compartments involved in insulin production and release by beta cells were generated for each of ribbon01 and ribbon02 using an expedited segmentation approach that allowed for the efficient yet accurate mark-up of organelles such as the Golgi ribbon and TGN, mitochondria and insulin granules (both immature and mature). Here, however, the 3D model data are presented with the dark blue spheres demarking the mature insulin granule populations omitted so that the other compartments such as immature granules and multi-granular/vesicular bodies can be more readily seen (for detailed visualization of mature insulin granules, see Fig. 4). Shown is the: plasma membrane (purple), nucleus (yellow), main Golgi ribbon (grey), trans-most Golgi cisterna (red), penultimate trans-Golgi cisterna (gold), mitochondria (green), multi-vesicular bodies (orange) and immature granules (light blue). Scale bars: 1 µm.

