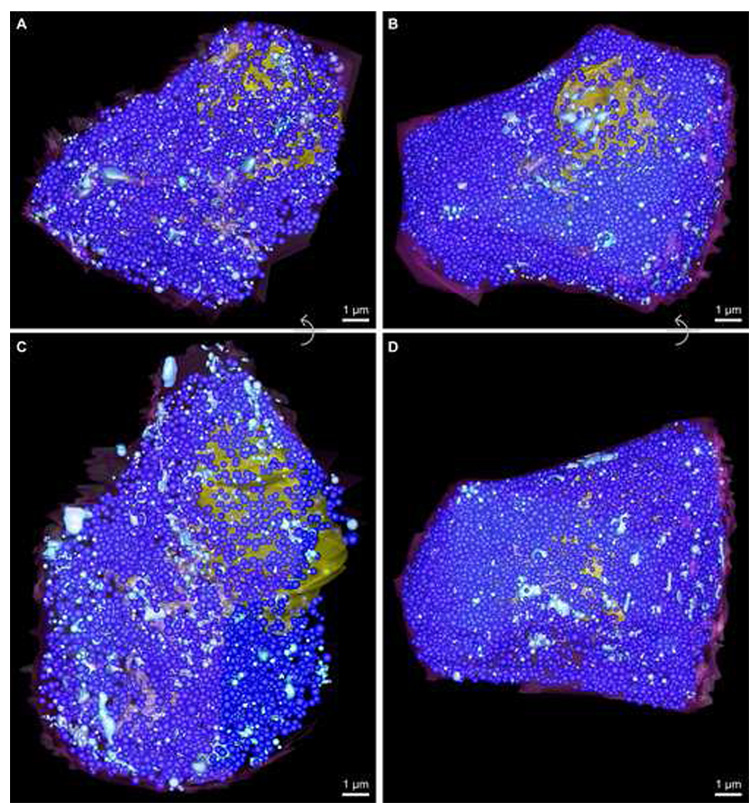
Fig. 4.
Figure panel showing the relative number and distribution of both mature and immature insulin granules in both beta cell reconstructions. Mature insulin granules are demarked as dark blue spheres, while immature secretory granules are colored light blue (for unobstructed views of the number and distribution of immature granule pools in each cell, see Fig. 3; due to the crowded appearance of the cytosol because of the numerous insulin granules, this figure panel is best viewed electronically). A and C show top and side views, respectively, for ribbon01, which contained 3370 mature insulin granules (average diameter 280 nm) and ~700 immature granules. Likewise, B and D reveal top and side views, respectively, for ribbon02, which contained 8250 mature insulin granules (average diameter 245 nm) and ~520 immature secretory granules. Scale bars: 1 µm.

