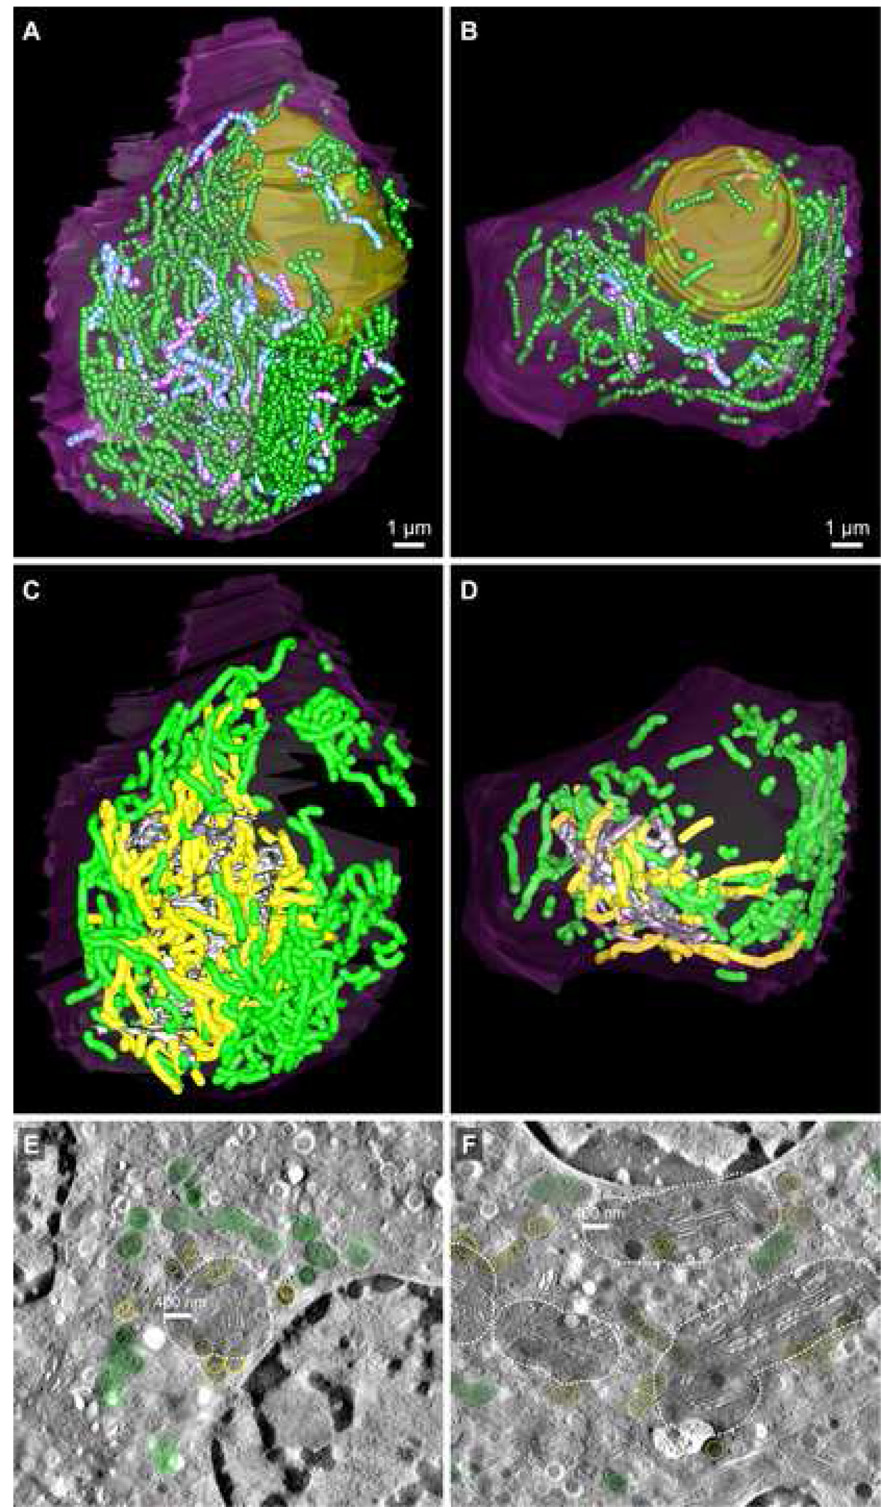
Fig. 7.
Mitochondrial organization and distribution in ribbon01 (A, C, E) and ribbon02 (B, D, F). A & B: The relative number and distribution of branched (main lengths: light blue; branches: mauve) versus non-branched (green) mitochondria are shown; branch points are highlighted with red spheres. Also refer to Table 2. Scale bars: 1 µm. C–F: A proximity-distribution analysis of mitochondria versus the Golgi ribbon was undertaken to assess relative differences in the extent of mitochondrial clustering to the Golgi between cells. C & D: The subset of mitochondria that came within an arbitrary (400 nm) zone of close approach to any surface of the Golgi ribbon are highlighted in yellow, while the remainder are colored green. E & F: Tomographic slices from ribbon01 (E) and ribbon02 (F) that show the arbitrary 400 nm proximity zone around the Golgi ribbon (shaded; dotted white line). The segmented Golgi (grey), proximal (yellow) and distal (green) mitochondria are visible. Scale bars: 400 nm.

