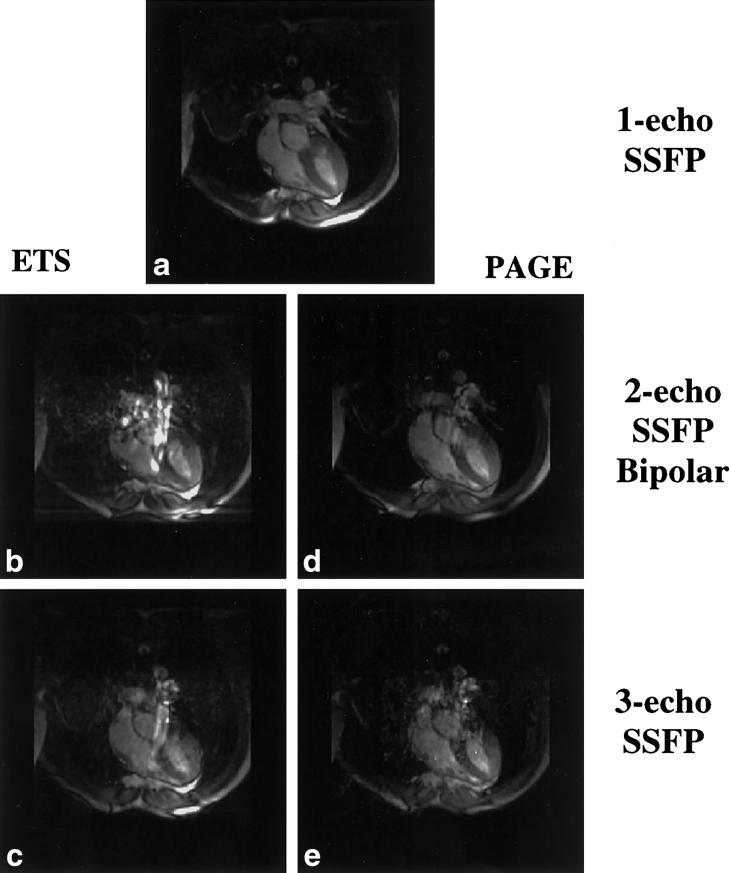
FIG. 8.
Aortic flow artifact visible in long-axis images of the heart. The (a) single-echo SSFP image does not exhibit flow artifact; however, ETS images for (b) two- and (c) three-echo SSFP (left column) are considerably more susceptible to this artifact than (d and e) PAGE-reconstructed images (right column). Different phase-encode ordering schemes led to drastic differences in phase-encode blip sizes between the ETS and PAGE acquisitions, and therefore to differences in flow artifacts.

