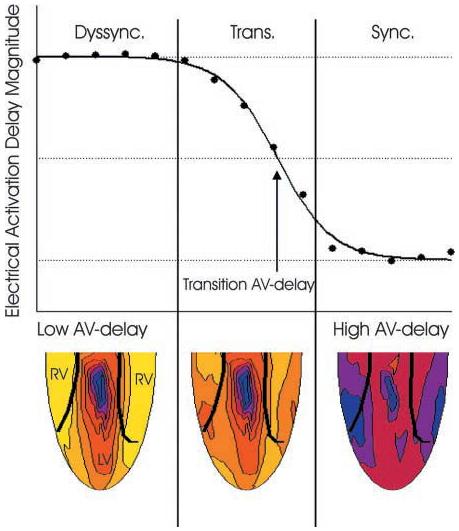
Fig. 2.

Example of electrical activation delay magnitude (EADM) plotted as a function of atrioventricular (AV) delay. At low AV delay values, corresponding to LV paced activation, EADM is at the top asymptote [highly dyssynchronous (dyssync) region]. At high AV delay values, corresponding to intrinsic activation from the RA pacing stimulus, electrical activation delay magnitude (EADM) is close to lower asymptote (synchronous region). The transition region represents fusion of the two activation patterns. The transition AV delay is defined as the AV delay at which the curve fit to the data crosses through the midpoint between the two asymptotes. Example epicardial electrical activation time maps are shown for each region, where blue is early and yellow is late. In the dyssynchronous region, maps demonstrate early activation near the LV pacing site and late activation of the RV. In the transition region, maps demonstrate fusion between the LV stimulus and Purkinje activation. In the synchronous region, the heart is activated synchronously and almost entirely through the Purkinje system.
