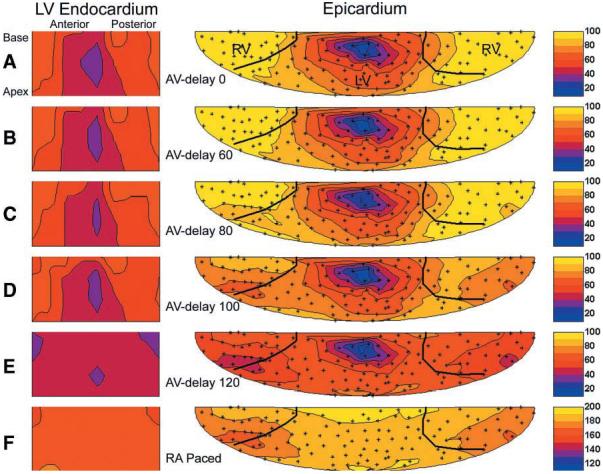
Fig. 3.

Endocardial and epicardial electrical activation maps for LV pacing at increasing AV delay and RA pacing. For both the epicardial and endocardial surface maps, the view is from the outside of the heart toward the inside. The broad black lines on the epicardial maps indicate the insertion of the RV as digitized. Endocardial and epicardial maps are centered about the earliest activation point for AV delay = 0. The small “+” symbols show the locations of the epicardial electrodes. Color transitions are in steps of 10 ms (see color bar on the right). Times are referenced to the LV pacing stimulus for LV pacing and to the RA pacing stimulus for RA pacing. A–F, different AV delays for left ventricular pacing in a single representative animal; F indicates right atrial pacing in same animal.
