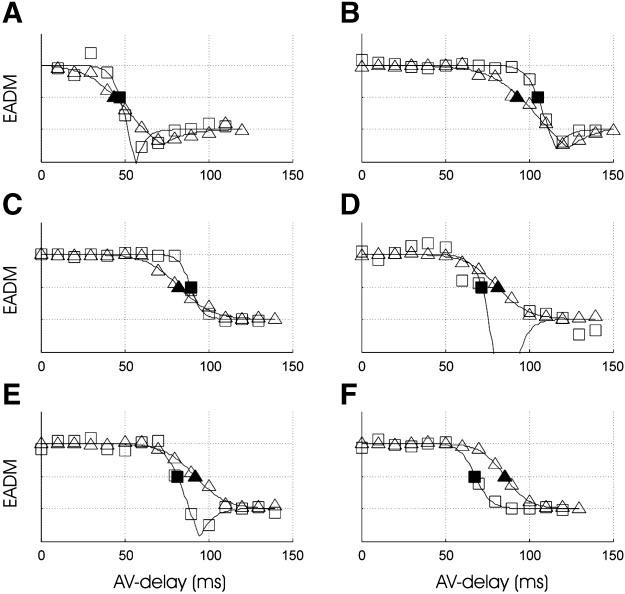
Fig. 4.

Electrical activation delay magnitude (EADM) normalized and plotted as a function of AV delay for the endocardium (□) and epicardium (●) for each animal (A–F). As AV delay is increased, endocardial and epicardial synchrony transition from the top (dyssynchronous) asymptote to the bottom (synchronous) asymptote. The endocardial (■) and epicardial (▲) transition AV delays (AVt) are shown.
