Fig. 5.

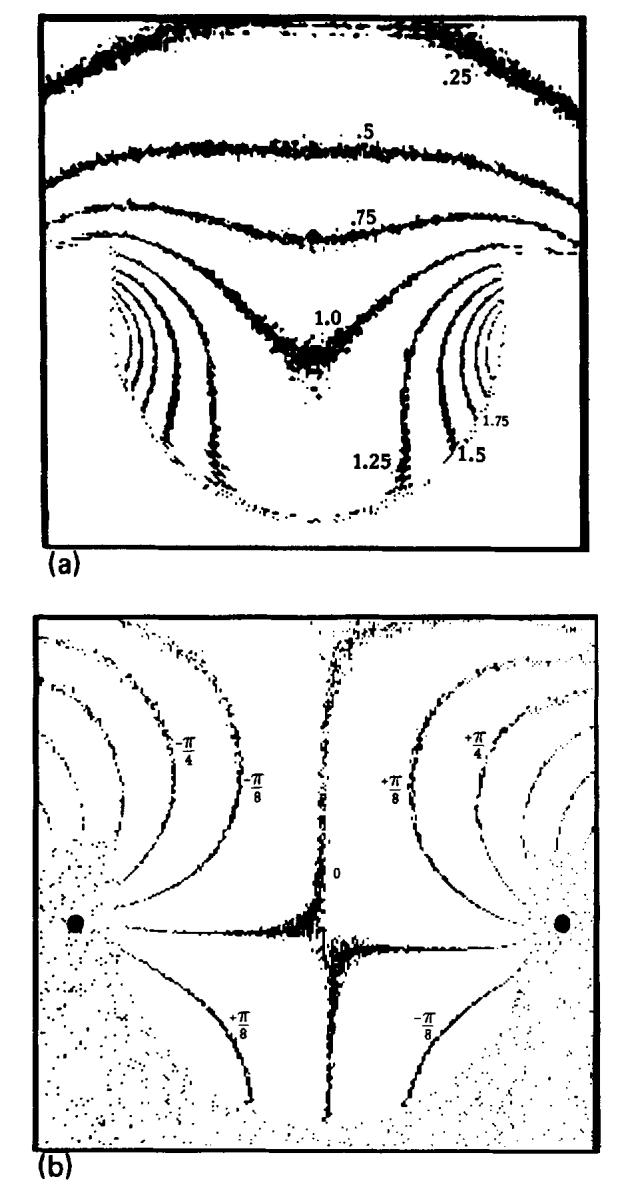
Measured coil sensitivity and phase. (a) A contour plot of the measured relative magnitudes of image vectors r(x, y) for a uniform phantom. (b) An isophase contour plot of the measured phase φ(x, y).

Measured coil sensitivity and phase. (a) A contour plot of the measured relative magnitudes of image vectors r(x, y) for a uniform phantom. (b) An isophase contour plot of the measured phase φ(x, y).