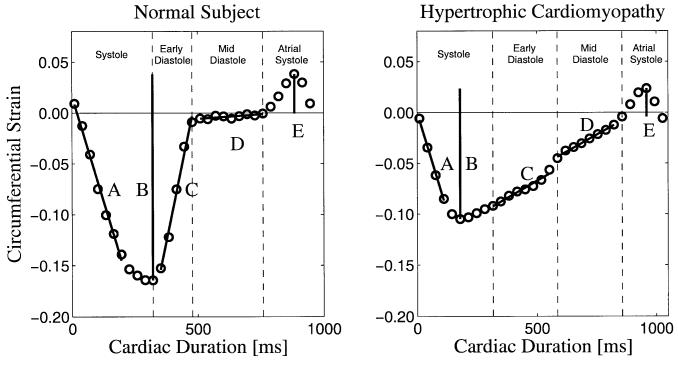
FIG. 1.
A sample curve of the LV midwall circumferential strain in the inferior wall. Indices of cardiac function are shown: A, systolic strain rate; B, total systolic strain; C, early-diastolic strain rate; D, mid-diastolic strain rate; and E, lengthening subsequent to atrial systole. Measures B and E were used to calculate the percent lengthening subsequent to atrial systole, defined as E/B.

