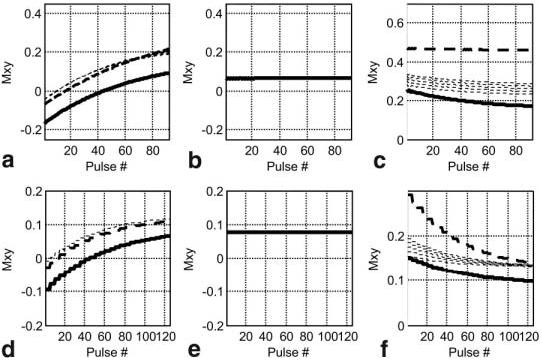
Figure 10.

Simulated magnetization for single-shot TrueFISP (a–c) and segmented TurboFLASH (d–f) examples with normal myocardium (solid bold line), MI (dashed lines), and blood (bold dashed line): (a and d) T1-weighted IR data, (b and e) reference data, and (c and f) T2-weighted data. Several values of T2 were used for MI to simulate the expected range from acute to chronic MI due to possible edema.
