
Figure 4.
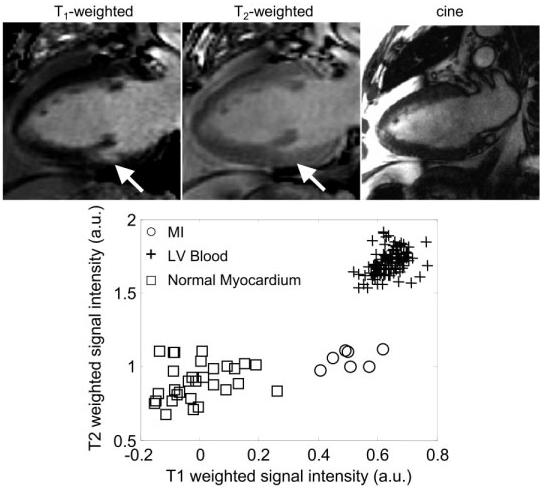
Long-axis images for a patient with a small subendocardial MI, illustrating the case of poor contrast between blood and MI: T1-weighted image (top left), T2-weighted image (top center), cine image (top right) of the same slice prescription at same cardiac phase acquired at a separate breath-hold, and scatter plot of signal intensities for normal myocardium, MI, and blood.