
Figure 8.
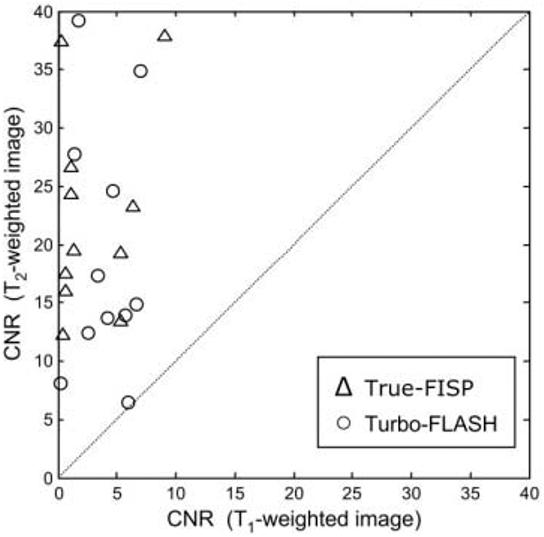
Scatter plot of the measured MI-to-blood CNR for T2-weighted vs. T1-weighted images (N = 11 patients). The CNR for the T2-weighted image was greater than or equal to the CNR for the T1-weighted image in all cases (i.e., above the dotted line representing equality).