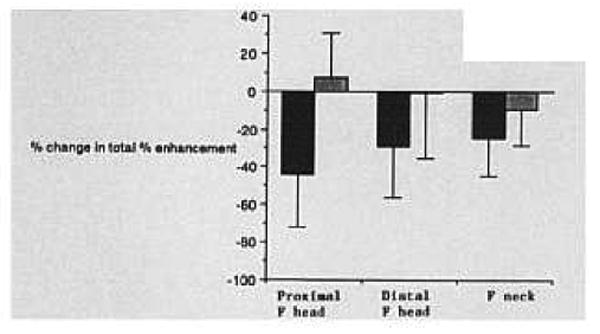
Fig. 5.

Percent change in total percent enhancement after ligation (see Methods section for definition). A statistically significant decrease was noted for all three regions after ligation. The black bars represent the left (ligation) side; the shaded bars represent the right (control) side.
