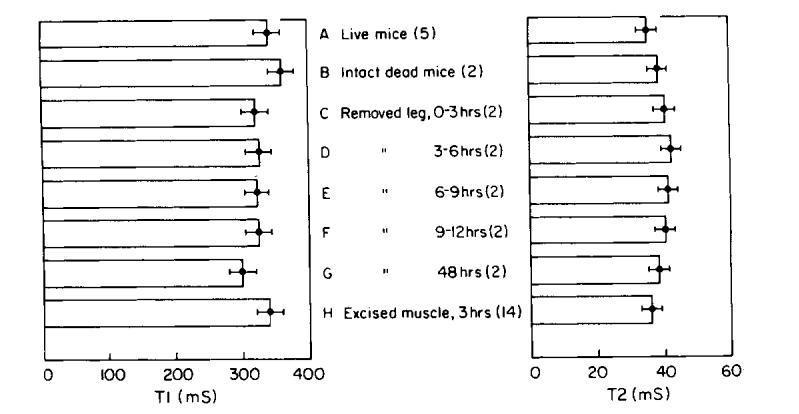
FIG. 10.

Results from in vivo and in vitro experiments at 6 MHz. (A) live mice; (B) intact, dead mice; (C-F) removed legs measured from death to 12 h following death, over consecutive 3 h intervals; (G) removed legs measured 48 h following death; (H) muscle tissue samples from legs, measured within 3 h after death. Error bars represent standard deviation from 25-40 experiments. Five mice were used for A, 2 mice for B-G, and 14 for H.
