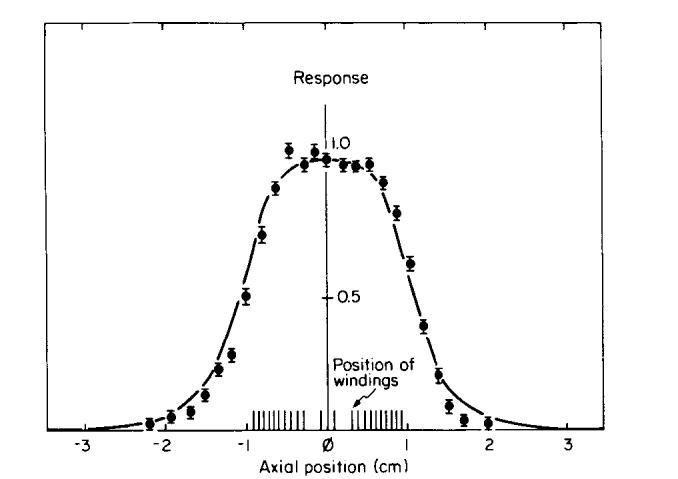
FIG. 2.

A response curve for a typical coil design. The data points are measured signals following a π/2 pulse from a 0.5 cm thick sample of glycerol positioned at various points along the axis of the coil. The error bars represent the standard deviation from four such measurements. The solid curve is the predicted response from Eq. [1]. The coil winding pattern is shown on the horizontal axis.
