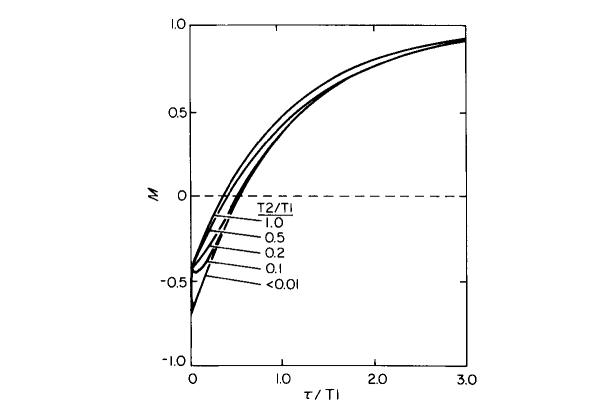
FIG. 3.
Simulation of T1 inversion-recovery experiments using an infinitely long sample extending through the mouse probe. The lower relaxation curve results when T2 ≪ T1 while the upper curve is for the case T2 = T1. Intermediate values of T2/T1 generate intermediate curves. The curve for T2/T1 = 0.1 approximates the experimental conditions when mouse legs are measured.

