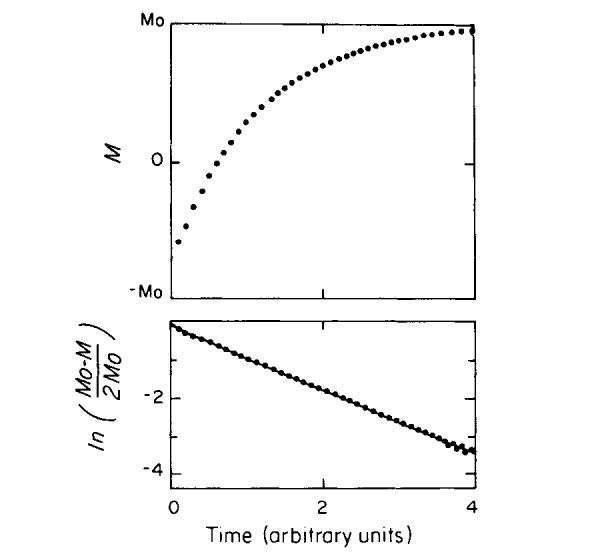
FIG. 4.

A typical relaxation curve from an inversion-recovery experiment is shown in the upper graph. The logarithmic transformation of the data and computer fit is shown in the lower graph. The relaxation time is related to the slope of the line through the points. The data shown spans ∼3 relaxation times.
